
This is an introduction and tutorial on community mapping designed specifically for community groups and organisations in the city of Galway, Ireland. The tutorial probably requires 1 hour in total but it is broken into a numbered parts so that you can easily save and return to your map and progress in your own time.
Contents:
Introduction: What you will learn in this tutorial.
Part 1
- What is Open Data?
- Getting Open Data for your map.
- Local Government Data – Cycle Lanes
- Local Government Data – Arts Centres
- Community Mapping Data – Space Engagers
Part 2 – Creating your own map with free tools.
- Setting up a user account for Open Street Map.
- Create a map on UMAP
- Creating your layers.
- Importing Open Data to your layers.
- Editing colour, shape and icons for map markers.
- Create your own layer and custom map markers.
- Adding links to your marker description.
- Adding Images to your marker description.
- Collaborative Mapping
- Sharing your mapping data.
- Embedding your map on a website
Introduction: What you will learn in this tutorial.
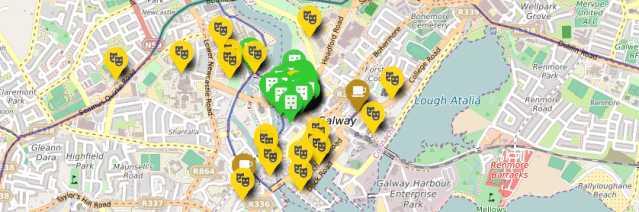
In this tutorial you will learn how to source Open Data and create your own map. UMAP is a free tool that any community organisation or group can use to easily create simple interactive maps. I am providing this tutorial so that local groups in Galway can get a sense of how easy it can be to start creating your own maps. For more advanced customisation of maps it is recommended that organisations host their own mapping platforms and make their mapping data available using Open Data Licenses. However in many cases this kind of self-hosting may well be surplus to requirements and as such free tools such as UMAP may suffice. The tutorial is in two parts. Part 1 deals with sourcing Open Data and Part 2 is an introduction to UMAP.
http://umap.openstreetmap.fr/en/map/galway-demo-map_200689
Part 1
-
What is Open Data?
I have previously emphasised the importance of using shared Open Data standards. This tutorial will also illustrate why Open Data is important for community organisations and an essential component of any successful community mapping project.
Community Mapping projects may generate data in the course of a workshop or Community Organisations may have more formal sources associated with their day to day work. For example local government, academic institutions, partner community groups or organisations.
In Ireland many local and national government data sources are hosted on ARCGIS. ARCGIS is a proprietary, commercial map services provider. A common problem when working with proprietary platforms is what is called vendor lock in. Commercial providers often require their customers to use proprietary file formats that only work with that service provider and the features it provides. Institutions invest in these services spending significant sums on software licenses and on training staff. These factors combine to place customers in a position of dependence on a single service provider with the costs of changing to perhaps more innovative competitors often considered prohibitive. This is the lock in. Another problem with this is that innovation in services only moves as fast at the platform permits. I strongly advise against community based organisations with limited budgets and staffing to invest in these kinds of proprietary services. So what are the alternatives? There are many but it depends on the needs of your organisation. Often free or low cost, Free Software and Open Source tools very often get the job done. For sophisticated customisation of mapping features there are also non-proprietary alternatives available for self-hosting of mapping projects. For example QGIS https://www.qgis.org. The benefits of Free Libre Open Source Software (FLOSS) are more than just cost savings. FLOSS development is fundamentally committed to the principle of open licensing and open technical standards such as file formats. This commitment aims to ensure that the technology and licensed works in this case map data are designed to be interoperable across software and platforms. That is they are designed specifically to avoid the kind of limitations on innovation that vendor lock in places on organisations.
When it comes to Irish government data there is some good news and in recent years there has been a shift towards publishing data using Open Data licenses. This does not mean that all data is available and there are still considerable limitations. For example the data of the legacy Galway Green Map is not available for other groups to use without establishing a formal relationship with the council. For the purposes of this tutorial I am glad to report that Galway City and County Council have made some of their mapping data available using Open Data Licenses. In fact this tutorial would not be possible without it. ARCGIS can grant permissions for map data to be Open Data. I would encourage the councils to the extent it is possible to make all it’s map collection Open Data. This enables Open Innovation making it possible for community groups and organisations to interact and make practical and derivative works from the maps. Old maps can find a new lease of life when made available in this way. Rather than each group having to start from scratch each time, the hard work that was put into those maps is available to build upon.
2.Getting Open Data for your map.
For this tutorial you will combine Open Data from a number of different sources –
- (A) http://opendata-galwaycity.opendata.arcgis.com/ (Cycle Lanes)
- (B )https://data.gov.ie/dataset/galway-city-public-arts-facilitiesa2717 (Arts)
- (C) https://app.spaceengagers.org/#/projects/4/ (Community Project)
3. Local Government Data – Cycle Lanes
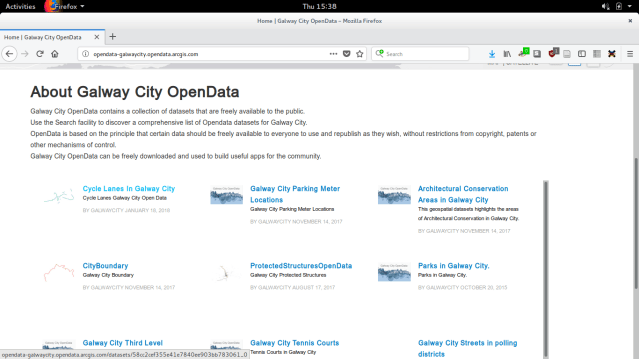
Open http://opendata-galwaycity.opendata.arcgis.com/ to gather Open Data.
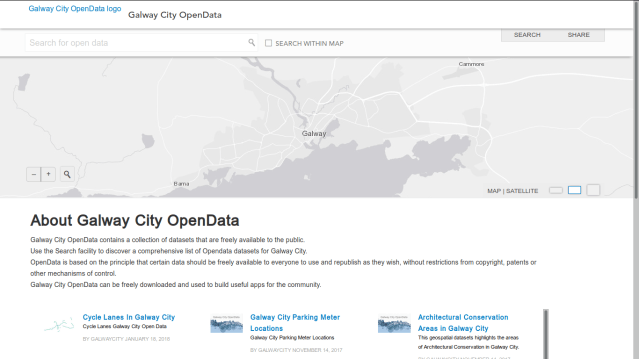
3.1 Local Government Data – Cycle Lanes
Select “Cycle Lanes in Galway City”
3.2 Local Government Data – Cycle Lanes
You can see in the licensing section of the page that the map is licensed with a Creative Commons License (http://creativecommons.org/licenses/by/4.0/). If you follow the link you will see that this means you are free to adapt and share the map files on the basis that you attribute the source and that derivative works are available to others under a similar open license. A data commons, a shared resource, like this is made possible when many people share their work and knowledge for mutual benefit. This is Open Data.
On the right you see some options. Select download database, then select API this will give you two further options. Select and copy the link from the GeoJSON box. You will use this to create a Cycle Lane Layer on your map of Galway.
This layer will update automatically on your map any time the city council modifies their original source map. This is a good example of the kind of conveience that Open Data makes possible.
You can open up Word, Notepad or any application where you can paste and keep the lnks for convenience.
I’ll paste it here –
http://opendata-galwaycity.opendata.arcgis.com/datasets/58cc2cef355e41e7840ee903bb783061_0.geojson

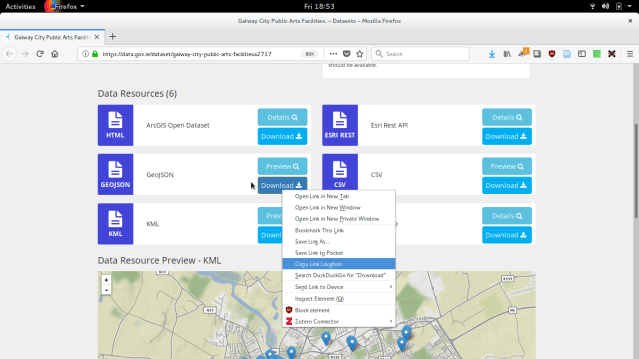
4.1 Local Government Data – Arts Centres
Now go through a similar process. This time get map data on ‘Galway City Public Arts Facilties’ which you can find through –
Again you can see that the map is made available with a Creative Commons License.

While the option is to download it is not neccessary and you can simply right click on the ‘download option’ and select to copy the link location the same as in the previous step and paste the GeoJSON somewhere it will be easy to find like a text document. I will paste it here –
http://opendata-galwaycity.opendata.arcgis.com/datasets/e70c45513c564f52be14816a34ce3209_0.geojson
5.1 Community Mapping Data – Space Engagers
This time you will download data from a Community Mapping Project. SpaceEngagers make available the data from community mapping projects they have taken part in. In this case there is no license data on the website. However having spoken with one of the lead software developers from Space Engagers he assured me that the data was Creative Commons Licensed the absence of a notice was a small matter of updating the website. Normally you should assume full copyright but I felt it was important to include some community produced data in the demo.
Go to this link https://app.spaceengagers.org/#/projects/4/
Alternatively you can go to the SpaceEngagers.org website and then click on the ‘View Map’ Option.
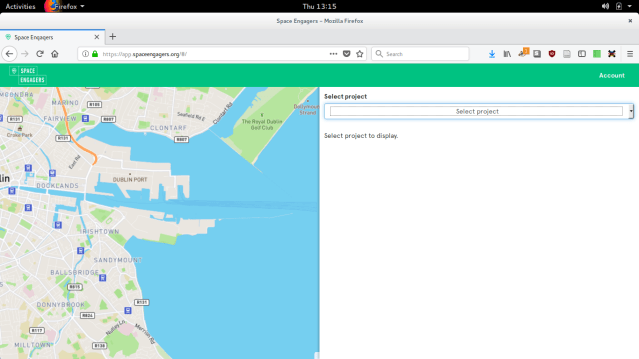
5.2 Community Mapping Data – Space Engagers
Select a project from the options.
5.3 Community Mapping Data – Space Engagers
I chose the project ‘Space Engagers’ as it has a number of data points in Galway city that might be interesting for our map. On the left of the screen you can see a second menu called ‘Layers Panel’ when you click on this you see an option to ‘Export’ and you can choose the ‘KML’ file option. Save this to your computer.
Now you should have three data sets. In part 2 of the tutorial you will use these to create your own map.

Part 2 – Creating a map with free tools
1.1 Setting up a user account for Open Street Map
Create an account with https://www.openstreetmap.org/. The ‘Sign Up’ option is in the top right. You will use this user account to login to http://umap.openstreetmap.fr

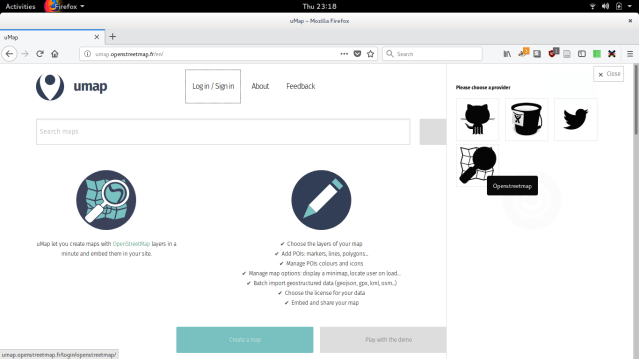
1.2 Setting up a user account for Open Street Map
Go to http://umap.openstreetmap.fr when you click on login the side panel will present you with a number of login options. You can login with your new OpenStreeMap account by clicking on the black magnifying glass. You will momentarily be redirected to the OpenStreetMaps site and asked to login and approve the request. When this is done the UMAP page should refresh and you will see your username beside the login option.
2.1 Create a map on UMAP
Now select the Create Map option on the top right.

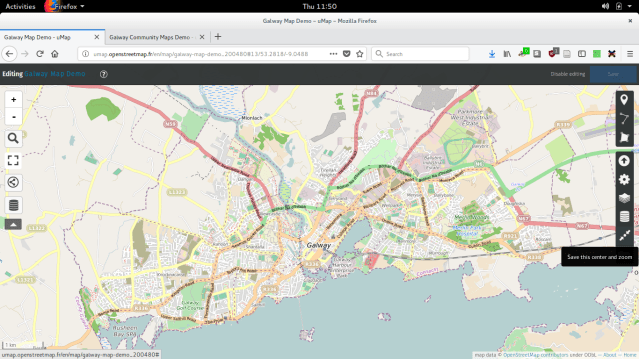
2.2 Create a map on UMAP
When the new map opens one of the first things to do is use the zoom tools to find Galway. Once you have Galway in the frame you can use the ‘Save this centre and zoom’ option. This will mark the city as the center of your map. The button looks like –

3.1 Creating your layers.
Next you will want to create some layers for the map. You will then import the data you gathered earlier in Part 1 of the tutorial.
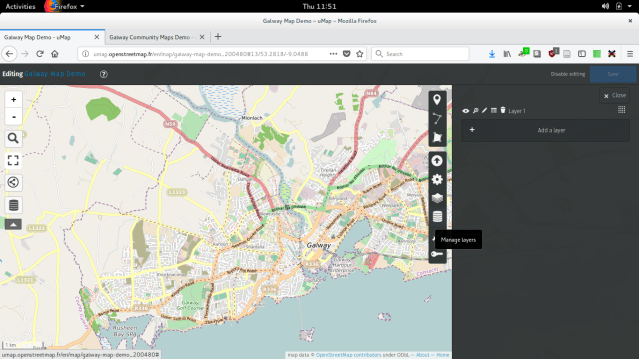
Click the Layers button

A side panel will pop out select the option to ‘Add a layer’
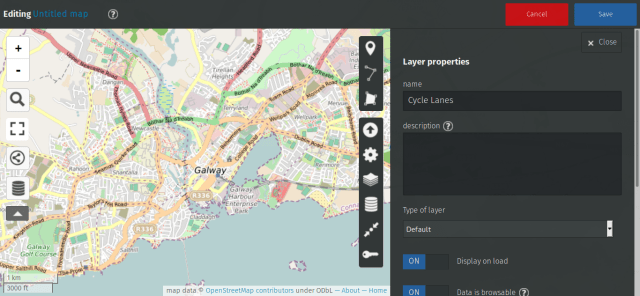
3.2 Creating your layers.
Name your first layer ‘Cycle Lane’ then click ‘Save’. Now repeat the process and create two new layers one called ‘Arts’ and the other you can call ‘SpaceEngagers’.
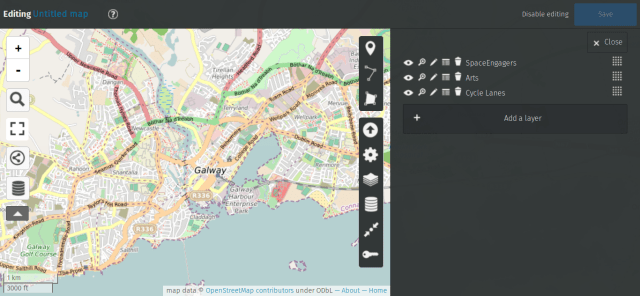
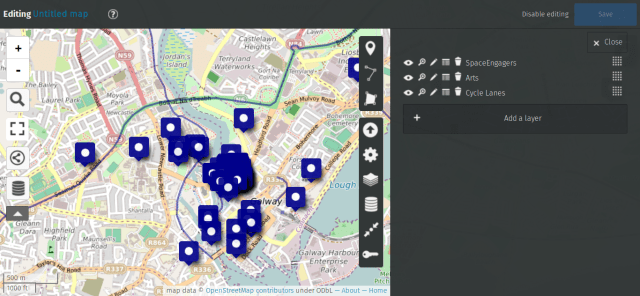
3.1 Creating your layers.
When ready you will have three layers something like this –
4.1 Importing Open Data to your layers.
Now it’s time to import the data. Let’s start with the ‘Cycle Lanes’.
Remeber earlier you copied the links to the datasets for temporary keeping into a text document. This is good practice when working alone but for convenience I’m including them here. Again copy this link below.
http://opendata-galwaycity.opendata.arcgis.com/datasets/58cc2cef355e41e7840ee903bb783061_0.geojson
4.2 Importing Open Data to your layers.
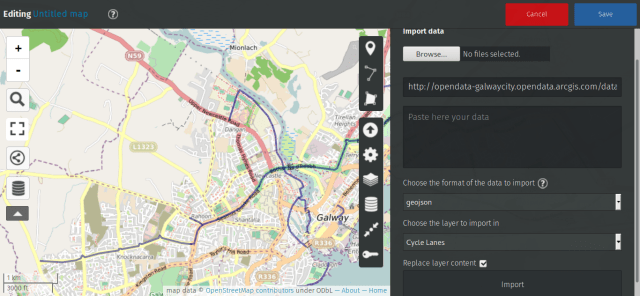
Now click on the ‘Import Data’ Option.

Paste the link into the box that says ‘Provide an URL here’. *(not my bad grammar)
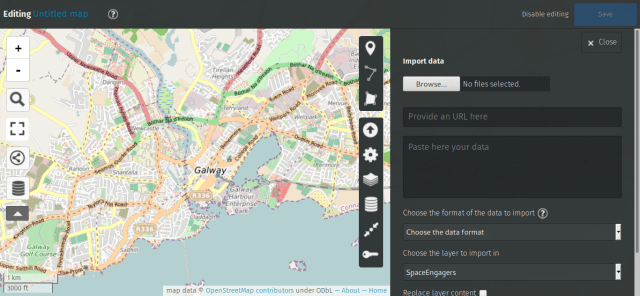
4.3 Importing Open Data to your layers.
- Paste the link
- ‘Choose the format of the data to import’ option ‘geojson’
- ‘Choose the layer to import in’ which will list the layers you created previously and where you can select ‘Cycle Lanes’.
- Finally select the ‘Replace layer content’ checkbox
- Click on the ‘Import’ button at the bottom.
You should see the Cycle Lanes appear on your map.
Congratulations you just imported your first layer of Open Data to your map.
Click ‘Save’. Now rinse and repeat :)
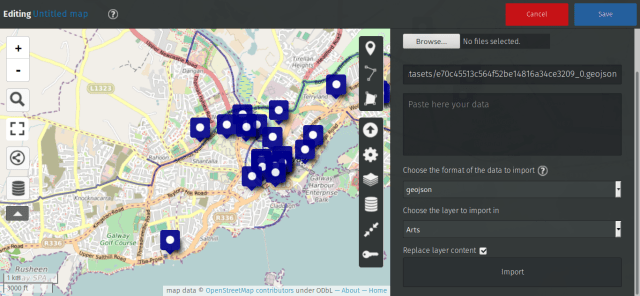
4.4 Importing Open Data to your layers.
Now for ‘Arts’. Simply repeat the same steps previous with ‘Arts’ geojson link but select the ‘Arts’ layer you created.
4.5 Importing Open Data to your layers.
Repeat the previous steps but this time instead of copying the link select the browse option and import the KML file that you downloaded from the SpaceEngagers website. Follow the previous steps for importing and select the ‘Space Engagers’ layer.
The Space Engagers Maps has points on it from different countries including Germany and Africa and when you save your map it may zoom out. Not to worry just zoom in to Galway again using the zoom navigation tools on the left.
5.1 Editing colour, shape and icons for map markers.
You will now see many more points on the map but they are all the same colour so let’s give them their own icons. Go back to the Layers section. It’s the icon that looks like a stack of pancakes. You can see your list of layers.
5.2 Editing colour, shape and icons for map markers.
To edit your layer properties click on the small pencil icon. Then click on ‘Shape properties’ and you will see an option to change the colour of the icons.

5.3 Editing colour, shape and icons for map markers.
There are also options for ‘Icon shape’ I selected the Drop shape and there are a number of standard ‘icon symbols’ you can choose from.
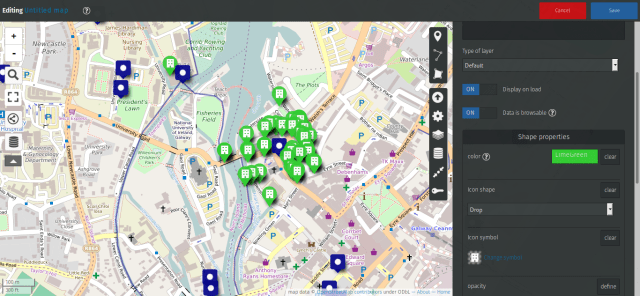
If you would like to use custom icons. You can insert a link to the icon image. In this example for demonstration purposes I incorporated an icon from Green Maps. Under ‘Shape Properties’ you can define the ‘Icon Symbol’ and insert the remote link to the image. (I do not have permission to use the Green Maps icons so I included this for demonstration purposes only and it is removed from the final map.)

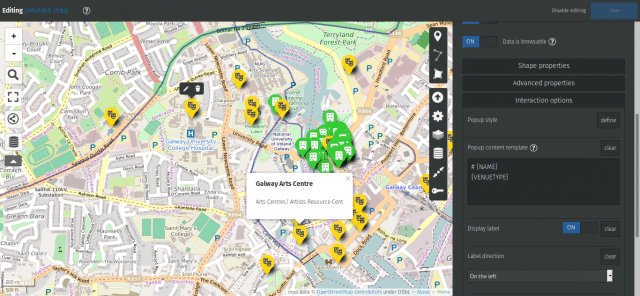
5.4 Editing colour, shape and icons for map markers.
You can also edit the ‘interaction options’. Don’t be afraid to experiment with these options. By changing the tags in the ‘Popup content template’ to match the categories in the original file I was able to add greater details for the points. To view your map click ‘Save’ and then ‘Disable Editing’
6.1 Create your own layer and custom map markers.
Adding links to your marker description.
Adding Images to your marker description.
Now to create your own layer and add some custom points to the map.
First as before select the layers option on the right and ‘Add new Layer’. For this example create a layer for places for Tea and Coffee. Fill out the details and select a nice colour and cup for the icon and save.

6.2 Create your own layer and custom map markers.
For this example you will place a marker for ‘The Secret Garden’. The address is ‘4 William Street West, Galway’ you can find these kinds of details from a web search. Find the location on the map and you will see that someone has already put The Secret Garden on Open Street Map base map but you will add a little more detail.
Click on the create marker icon.

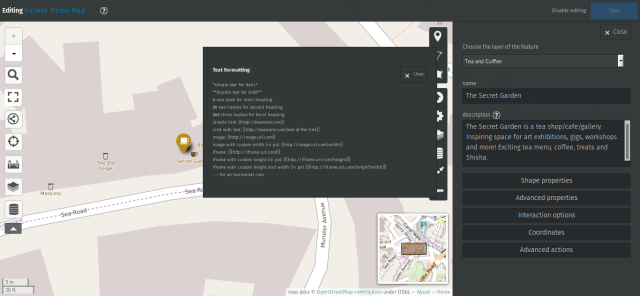
When you move over the map the mouse pointer turns to a plus shaped target then click on the place where you want to place the marker. The options for your new point appear on the right. Fill out the name and a short description. If you click on the question mark beside the description you will see a number of options for ‘Text formatting’ you can use these to format text, add images or links to your marker description.
7. Adding links to your marker description.
I added links to the Secret Garden’s website and facebook page by putting the following text in the description box. Simply put your page links in square brackets to create links.
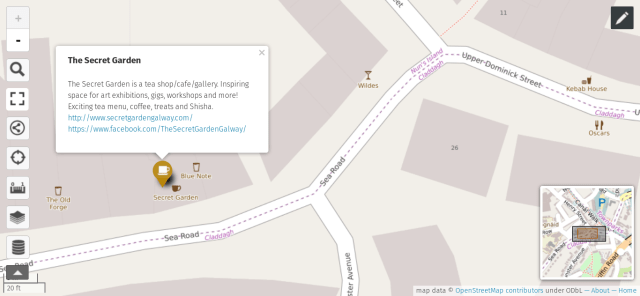
The Secret Garden is a tea shop/cafe/gallery. Inspiring space for art exhibitions, gigs, workshops and more! Exciting tea menu, coffee, treats and Shisha.
[[http://www.secretgardengalway.com/]]
[[https://www.facebook.com/TheSecretGardenGalway/]]
Once you have saved your changes you click ‘disable editing’ and when you select your marker you will see a more detailed description.
8.1 Adding Images to your marker description.
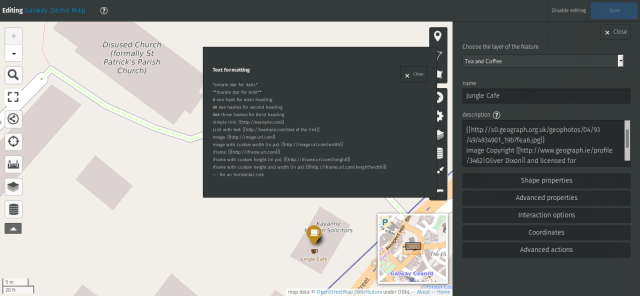
Let’s try another and this time add an image. I am adding the Jungle Cafe on Foster Street. I use the navigation tool to zoom out and in and I can see that someone has already put a coffee cup marker on the OpenStreet Map but of course I want to add some more detail for my own ‘Tea and Coffee’ map layer. Again you can see the options.
To the description box I add the following text.
**A nice cafe with good coffee and a great food menu.**
[[https://www.facebook.com/JungleCafeGalway/]]
{{http://s0.geograph.org.uk/geophotos/04/93/49/4934901_19b7fea6.jpg}}
Image Copyright [[http://www.geograph.ie/profile/3462|Oliver Dixon]] and licensed for [[http://www.geograph.ie/reuse.php?id=4934901|reuse]] under this [[http://creativecommons.org/licenses/by-sa/2.0/|Creative Commons Licence]].
LINE 1: I add double asterix to make the first line bold.
LINE 2: Again I add square brackets for the link.
LINE 3: In curly brackets I place a url link to a photo I found online of the Jungle Cafe.
Normally to use an image you will need permissions from the copyright holder. However since the person who took this photo has been so kind as to use a Creative Commons License for the work there is no need to ask since he has in advance granted users the permission to –
- Share — copy and redistribute the material in any medium or format
- Adapt — remix, transform, and build upon the material for any purpose, even commercially.
- On the basis that the author is given attribution.
So to use the image we must include a link that gives attribution to the author and this is what I do in –
LINE 4: This time in the description the links will be hidden and instead there will be clickable text. When you click on a link it will refer you to Oliver Dixons profile page as well as to further details on the Creative Commons License that he used.
Image Copyright [[http://www.geograph.ie/profile/3462|Oliver Dixon]] and licensed for
[[http://www.geograph.ie/reuse.php?id=4934901|reuse]] under this
[[http://creativecommons.org/licenses/by-sa/2.0/|Creative Commons Licence]].
8.2 Adding Images to your marker description.
Save your edits and leave the editing mode by clicking on ‘disable editing’. You can then click on your marker to see the results.

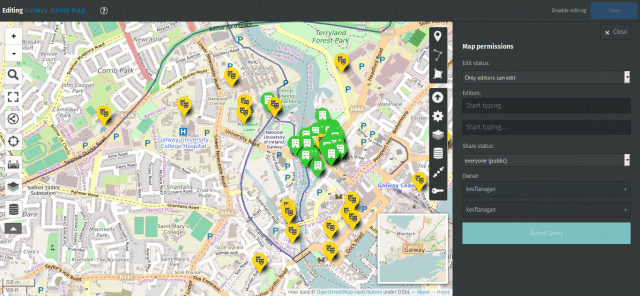
9. Collaborative Mapping
If you want to invite a friends of colleagues to collaborate then click on the small key icon. This will bring you to ‘Map permissions’ under ‘Edit Status’ you can change from ‘only owner can edit’ to ‘only editors can edit’ if you want a friend to join.
10. Sharing your mapping data.
Click on the Share button on the left side panel.

Under this set of options select the ‘Share status’ and decide if you want your map to remain private while you work on it with other editors or if you are ready to make your map public.
You also have the option to download your map data in multiple formats. You have the option to export the whole map or if you prefer you can return to the layers option and hide the layers you do not want to export leaving only the ones you do visible.
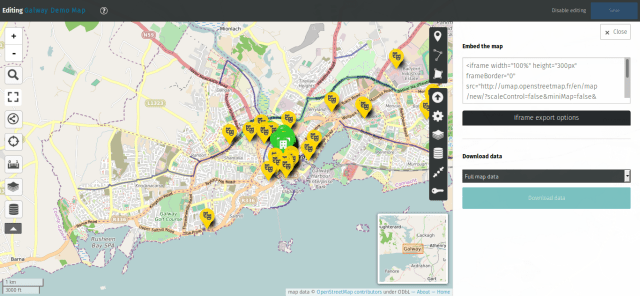
11. Embedding your map on a website
Some options will appear on the right. You can choose to use the iframes script to embed the map on your own site.
Some Closing Comments
That is it. This is only meant as a beginners introduction to mapping with UMAP. I hope you found it useful. I would encourage you to explore the various options.
A nice feature of this approach is that multiple organisations can make their own maps on UMAP and each can generate a GeoJSON feed. This means that a third party or a collaboration between organisations can create a map which can easily integrate map layers from partners. I hope this gives you a sense of what becomes possible when organisations whether local government or community groups share their data using open licenses.
Last but not least when publishing your map publicly online it is important to follow the agreement of the Open Data licenses and give attribution to the people who provided you with the source data.
Here again is the link to the demo map.
http://umap.openstreetmap.fr/en/map/galway-demo-map_200689
Other Resources:
UMAP Video Tutorial
The following article shows how to create a GeoJSON link from your UMAP.
http://www.linux-magazine.com/Issues/2017/200/uMap
Shareable Guide to Mapping
https://www.shareable.net/blog/the-complete-guide-to-hosting-a-mapjam-in-your-city
Workshop Design for Mapping the Circular Economy
https://community.oscedays.org/t/action-in-development-mapping-circular-organisations-mapjam/5953
All Ireland Mapping Resources
AIRO the All-Island Research Observatory has mapped extensive census data.
All-Island Research Observatory
http://airo.maynoothuniversity.ie/
All-Island Research Observatory – Galway City
All-Island Research Observatory – Galway County
Pobal Maps – (Of particular interest for community organisations in the city)
Childcare service / Deprivation Index / General Data / Geoprofiling
Data.Gov – An excellent source of Irish Open Data
Data.Gov – National Biodiversity Centre
https://data.gov.ie/publisher/national-biodiversity-data-centre
Space Engagers – Irish Community Mapping Project
Galway Mapping Resources
Local government mapping data was generally difficult to find through the city council website. If the public can’t find the maps they can’t use them.
Galway City Council Map Gallery
Legacy Galway Green Map
http://www.arcgis.com/home/item.html?id=41663142d79947979da5831d6b84084e
Galway City Council Open Data
http://opendata-galwaycity.opendata.arcgis.com/
Galway County Council Open Data
http://data-galwaycoco.opendata.arcgis.com/
Data.Gov – Galway City Public Arts Facilities (Not all Council data is on the one site)
https://data.gov.ie/dataset/galway-city-public-arts-facilitiesa2717
Data.Gov (NUI Galway)
https://data.gov.ie/publisher/nui-galway
Data.Gov (Marine Institute Galway)
https://data.gov.ie/publisher/marine-institute
Data.Gov – An Atlas of Breeding Birds of the Burren and Aran Islands 1993 – 1996
https://data.gov.ie/dataset/an-atlas-of-breeding-birds-of-the-burren-and-aran-islands-1993-1996
Green Maps
Examples of NYC Green Maps
http://www.greenmap.org/greenhouse/en/node/132
Mapping Our Common Ground
“This booklet is a guide to community and Green Mapping. It is based primarily on the experiences of the Common Ground Community Mapping project (now network), the University of Victoria Community Mapping Collaboratory in Canada, and the worldwide Green Map System.”
http://www.mapping.uvic.ca/project-name/mapping-our-common-ground-booklet
Green Maps and the Sustainable Development Goals
http://www.greenmap.org/greenhouse/en/node/26529
